DOHMH New York City Restaurant Inspection Results
introduction
The Department of Information Technology and Telecommunications of New York city (NYC DoITT) releases many data sets online for public use. An interesting one is about restaurant hygiene inspection results. It’s quite heart-breaking to check my favorite restaurants there.
In this post, I will pull out some information from it, such as the popular cuisines in the city, worst restaurants for the top cuisine types, etc.
The data can be accessed via the following links. As of Jul 18 2016, the csv file is about 160 MB.
The data can be loaded into pandas DataFrame with the following code.
filename = 'data/DOHMH_New_York_City_Restaurant_Inspection_Results.csv'
df = pd.read_csv(filename,encoding='windows-1252')
df = df[df["INSPECTION DATE"]!='01/01/1900']
df.info(null_counts=True)
I tried a few encoding schemes for pd.read_csv,
but there are still invalid characters in the data. For example,
characters with French accents are not decoded correctly.
Please let me know if you know how to fix it. Thanks.
Anomalies with strange inspection date (01/01/1900) are eliminated. We see then that this data set contains all inspection results from 07/26/2011 to 07/17/2016.
The info function provides the following result.
<class 'pandas.core.frame.DataFrame'>
Int64Index: 449573 entries, 0 to 450712 Data columns (total 18 columns):
CAMIS                    449573 non-null int64
DBA                      449573 non-null object
BORO                     449573 non-null object
BUILDING                 449455 non-null object
STREET                   449573 non-null object
ZIPCODE                  449573 non-null int64
PHONE                    449556 non-null object
CUISINE DESCRIPTION      449573 non-null object
INSPECTION DATE          449573 non-null object
ACTION                   449573 non-null object
VIOLATION CODE           442160 non-null object
VIOLATION DESCRIPTION    441936 non-null object
CRITICAL FLAG            449573 non-null object
SCORE                    421074 non-null float64
GRADE                    212342 non-null object
GRADE DATE               210769 non-null object
RECORD DATE              449573 non-null object
INSPECTION TYPE          449573 non-null object
dtypes: float64(1), int64(2), object(15)
memory usage: 65.2+ MB
Here the field CAMIS is the unique identifier for the restaurant,
DBA is the name of the restaurant, and CRITICAL FLAG is the
result of the inspection.
There are many repeated names in DBA, since many restaurants have multiple
sites.
There are three possible inspection results in CRITICAL FLAG.
Not Applicable means nothing wrong was found.
Critical means some serious issue was found, such as mice,
flies, raw/cooked food adulterated, etc.
Not Critical refers to issues such as improper plumbing,
improper non-food contact surface, facility not vermin proof, etc.
Further details of the violation can be seen in the VIOLATION CODE and
the VIOLATION DESCRIPTION fields.
CRITICAL FLAG
Critical          246880
Not Applicable      7637
Not Critical      195056
Looking at the inspection results, it seems the hygiene of the whole industry is in jeopardy.
the popular cuisines
In this section, I will examine the most popular cuisine in NYC based on the number of restaurants out there. Specifically, the following information will be extracted.
- top 5 popular cuisines and the corresponding restaurant numbers
- total number and average number of hygiene violations by cuisine types
- worst 5 restaurants for each cuisine type
- time evolution of the monthly violations for each cuisine type
To find out the most popular cuisine types, we can use the following code
by_cuisine = df[['CAMIS', 'CUISINE DESCRIPTION']] \
                .drop_duplicates(['CAMIS'])
                .groupby(['CUISINE DESCRIPTION'])
top5 = by_cuisine.size().sort_values(ascending=False)[:5]
Since each row in the DataFrame is an inspection and a restaurant can be inspected multiple times,
we need to count each restaurant only once by drop_duplicates(['CAMIS']).
We then extract all the hygiene violations for the top 5 cuisines using the following code
cuisines = top5.index.values

viols = df[df['CRITICAL FLAG']!='Not Applicable']
mask = viols['CUISINE DESCRIPTION'].isin(cuisines)
top_cuisines = viols[mask][['DBA', 'CAMIS','CUISINE DESCRIPTION', 'INSPECTION DATE']]
by_cuisine = top_cuisines.groupby(['CUISINE DESCRIPTION'])
v_counts = by_cuisine.size()

cuisine_facts = pd.concat([top5, v_counts],axis=1)
cuisine_facts.sort_values(by=0, inplace=True, ascending=False)
cuisine_facts[2] = (v_counts / top5).apply(lambda x: '%.0f' %x)
cuisine_facts.rename(columns={0:'# of restaurants',
                              1:'# of violations',
                              2:'avg violations'})
In the above code, we first save all hygiene violations in viols.
Using the groupby() function, we save the total number of violations for the top 5 cuisine
types in v_counts.
Then we combine the two Series top5 and v_counts with pandas.concat().
Some basic facts about the top 5 cuisines sorted by number of restaurants are as follows. To my surprise, there are a lot more American restaurants than other cuisine types. In terms of average violations per restaurant, Cafe/Coffee/Tea shops have significantly less violations.
                    # of restaurants  # of violations avg violations
American                        6034           102612             17
Chinese                         2395            48728             20
Cafe/Coffee/Tea                 1391            15493             11
Pizza                           1172            21034             18
Italian                         1031            20795             20
I also want to know the worst restaurants, i.e., the ones with most violations. Using the following code, you can see the five restaurants with most number of hygiene violations, for each cuisine type.
name_map = top_cuisines[['DBA','CAMIS']].drop_duplicates()
worst_by_cuisine = top_cuisines.groupby('CUISINE DESCRIPTION') \
                        .CAMIS.value_counts().groupby(level=0).head(5)\
                        .reset_index(name='# of violations')
worst_by_cuisine = pd.merge(worst_by_cuisine, name_map, on='CAMIS') \
                        .set_index(['CUISINE DESCRIPTION','CAMIS'])
The result is as follows. Fortunately, I haven’t been to many of them. You can see the worst Chinese restaurants are the worst of the worsts.
                              # of violations                         DBA
CUISINE DESCRIPTION CAMIS
American            40916695               88                    KEY CLUB
                    41709379               70       LONE STAR BAR & GRILL
                    41706342               69               ROCKAWAY CAFE
                    50000543               69                  BLACK TREE
                    41164678               68             NIOS RESTAURANT
Cafe/Coffee/Tea     41640196               63         CHECKPOINT BEN CAFE
                    41706722               56               EUROPEAN CAFE
                    41161594               50                      SMOOCH
                    41458679               46          ALEEF COFFEE HOUSE
                    41598755               45                      TROOST
Chinese             41289382               95       JADE ASIAN RESTAURANT
                    41586091               94  FENG CHENG YUAN RESTAURANT
                    41683816               89     MAX BAKERY & RESTAURANT
                    41602559               86               RED CHOPSTICK
                    41539257               76  FOO KEE SEAFOOD RESTAURANT
Italian             40745126               68        PINOCCHIO RISTORANTE
                    40725591               63                   TWO BOOTS
                    41563537               60                  BENITO ONE
                    41406564               59                  KEN & COOK
                    41551620               59                     VAPIANO
Pizza               40743368               82                    DOMINO'S
                    40580547               64              KNAPP ST PIZZA
                    50001396               63                  PIZZA PLUS
                    40604769               58             FAMOUS FAMIGLIA
                    41705032               58     GRANDMAS ORIGINAL PIZZA
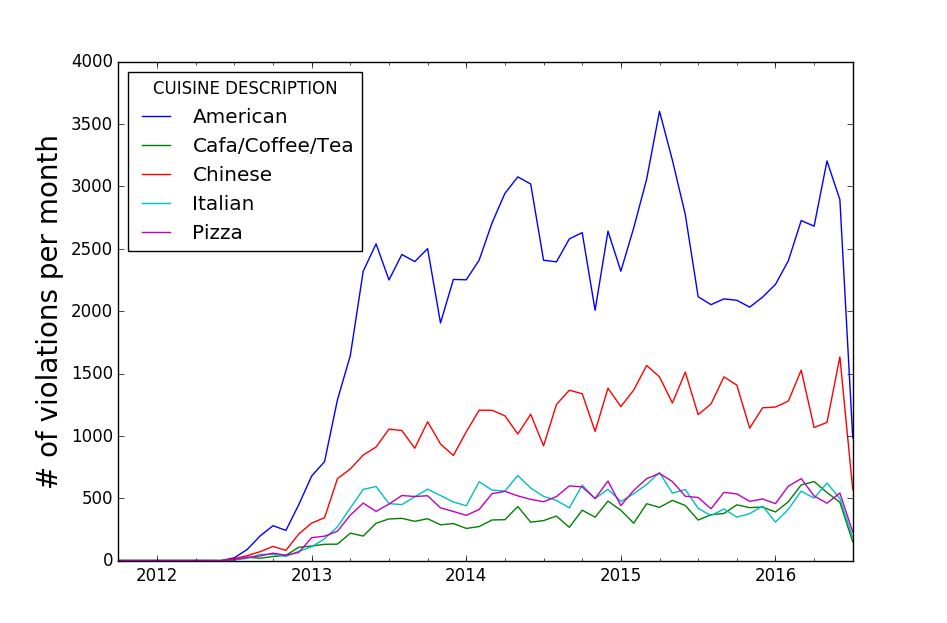
I also plot the time evolution of the hygiene violations for the
popular cuisines. The code is as follows.
The INSPECTION DATE field contains string like '07/18/2013'.
They are converted to pandas time series index.
top_cuisines.index = pd.to_datetime(top_cuisines['INSPECTION DATE'].values)
ts_cuisine = top_cuisines.groupby([top_cuisines.index.to_period('m'),
                                   top_cuisines['CUISINE DESCRIPTION']]) \
                         .size().unstack().fillna(0)
ts_cuisine.plot()
plt.ylabel('# of violations', fontsize=20)
plt.savefig('violation_by_cuisine_ts.svg', bbox_inches='tight')
And the result can be seen below.
It seems the American restaurants have poor performance in spring
time while the other cuisines have more consistent performance
over the year.
the boros
In this section, I will look into the hygiene violations in different boros. Specifically,
- most popular cuisine type in each boro and their average number of violations
- violation distribution among the five boros
- time evolution of the average number of violations in each boro
Firstly, I would like to know what are the most popular restaurants in each boro. The following code calculates the top five cuisines by number of restaurants in each boro.
vBORO = viols[viols['BORO']!='Missing'][['BORO','CRITICAL FLAG', 'INSPECTION DATE', 'CUISINE DESCRIPTION','CAMIS']]
vBORO = vBORO[vBORO['BORO']!='Missing']
cuisine_by_boros = vBORO.groupby('BORO')['CUISINE DESCRIPTION'] \
                        .value_counts().groupby(level=0).head(5) \
                        .reset_index(name='# of restaurants')
cuisine_by_boros.set_index(['BORO','CUISINE DESCRIPTION'],inplace=True)
Then I count the number of violations for each cuisine type in each boro, concatenate it with the number of restaurants, and then calculate the average number of hygiene violations for each cuisine type.
v_by_boro_cuisine = vBORO.groupby('BORO')['CUISINE DESCRIPTION'].value_counts()
result = pd.concat([cuisine_by_boros, v_by_boro_cuisine], axis=1, join='inner')
result[0] = (result[0] / result['# of restaurants']).apply(lambda x: '%.0f' %x)
result.rename(columns={0:'avg violations'}, inplace=True)
The result is as follows. In all five boros except Manhattan, American restaurants and Chinese restaurants are the most popular base on number of establishments. In Manhattan, however, Cafe/Coffee/Tea shops take the second place. Maybe it’s related to tourism. The tourists might prefer to grab something simple to save money and time.
                                    # of restaurants   avg violations
BORO           CUISINE DESCRIPTION
BRONX          American                          425               15
               Chinese                           330               17
               Pizza                             206               17
               Latin                             182               24
               Spanish                           128               20
BROOKLYN       American                         1254               17
               Chinese                           750               20
               Cafe/Coffee/Tea                   350               12
               Caribbean                         320               21
               Pizza                             306               18
MANHATTAN      American                         3066               18
               Cafe/Coffee/Tea                   757               11
               Italian                           596               21
               Chinese                           490               25
               Japanese                          459               21
QUEENS         American                         1026               17
               Chinese                           738               20
               Latin                             322               24
               Pizza                             271               18
               Cafe/Coffee/Tea                   212               11
STATEN ISLAND  American                          222               17
               Chinese                            81               17
               Italian                            72               18
               Pizza/Italian                      59               20
               Pizza                              53               19
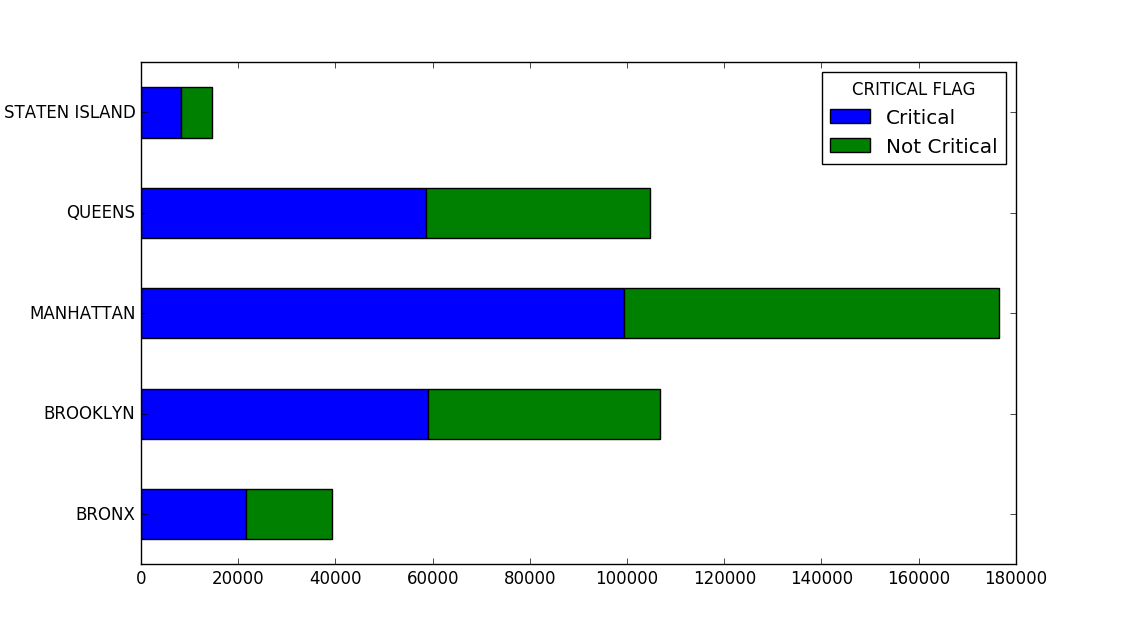
Then let’s check how many violations do each boro have in total.
by_boro = vBORO.groupby(['BORO','CRITICAL FLAG'])
flag_by_boro = by_boro.size().unstack()
flag_by_boro.plot(kind='barh',stacked=True)
The result is shown below. It seems that for all boros there are more critical violations than minor ones.
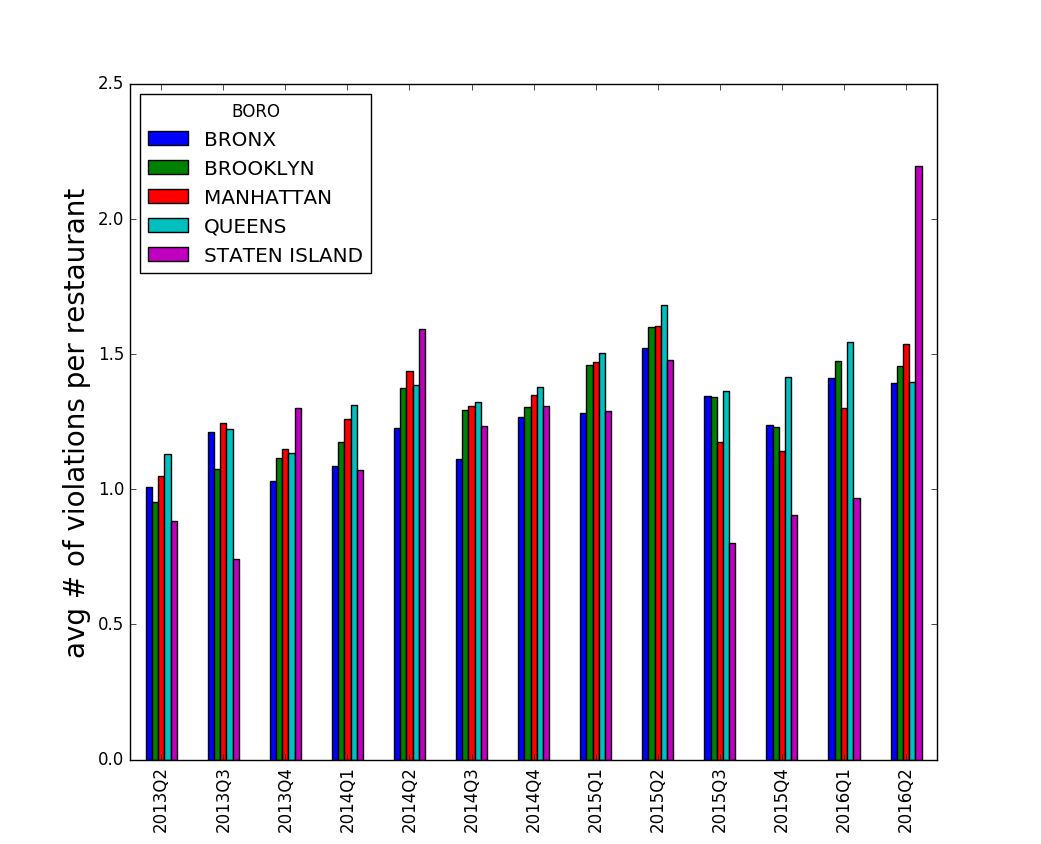
The quarterly violations per restaurant in each boro is shown as follows. Data before the second quarter in 2013 are omitted due to their small sample size. There are a few trends over the years
- Bronx, Brooklyn, Manhattan and Queens have similar performance
- Usually, Staten island has better performance
- Staten island had significantly worse performance in the last quarter
summary
This is a very preliminary exploration of this dataset. I intended to polish my pandas skills with it.
There are interesting projects one can do with this dataset. For example, there was a competition at DrivenData where the data scientist attempted to use Yelp data to predict the restaurant inspection data. See the link below if you are interested.


